Dr. Weeks’ Comment: Those that have eyes to see, let them see. This NASA video of the ocean currents is an impressionistic marvel. Let us all be careful not to criticize another’s view. Watch this movie!
Both the 20-minute and 3-minute versions are available in high definition here:http://svs.gsfc.nasa.gov/goto?3827
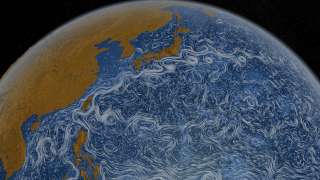
NASA Views Our Perpetual Ocean
ScienceDaily (Apr. 9, 2012) ”” The swirling flows of tens of thousands of ocean currents were captured in this scientific visualization created by NASA’s Goddard Space Flight Center in Greenbelt, Md.
“There is also a 20-minute long tour, which shows these global surface currents in more detail,” says Horace Mitchell, the lead of the visualization studio. “We also released a three-minute version on our NASA Visualization Explorer iPad app.”
Both the 20-minute and 3-minute versions are available in high definition here:http://svs.gsfc.nasa.gov/goto?3827
The visualization covers the period June 2005 to December 2007 and is based on a synthesis of a numerical model with observational data, created by a NASA project called Estimating the Circulation and Climate of the Ocean, or ECCO for short. ECCO is a joint project between the Massachusetts Institute of Technology and NASA’s Jet Propulsion Laboratory in Pasadena, Calif. ECCO uses advanced mathematical tools to combine observations with the MIT numerical ocean model to obtain realistic descriptions of how ocean circulation evolves over time.
These model-data syntheses are among the largest computations of their kind ever undertaken. They are made possible by high-end computing resources provided by NASA’s Ames Research Center in Moffett Field, Calif.
ECCO model-data syntheses are being used to quantify the ocean’s role in the global carbon cycle, to understand the recent evolution of the polar oceans, to monitor time-evolving heat, water, and chemical exchanges within and between different components of the Earth system, and for many other science applications.
In the particular model-data synthesis used for this visualization, only the larger, ocean basin-wide scales have been adjusted to fit observations. Smaller-scale ocean currents are free to evolve on their own according to the computer model’s equations. Due to the limited resolution of this particular model, only the larger eddies are represented, and tend to look more ‘perfect’ than they are in real life. Despite these model limitations, the visualization offers a realistic study in both the order and the chaos of the circulating waters that populate Earth’s ocean.
Data used by the ECCO project include: sea surface height from NASA’s Topex/Poseidon, Jason-1, and Ocean Surface Topography Mission/Jason-2 satellite altimeters; gravity from the NASA/German Aerospace Center Gravity Recovery and Climate Experiment mission; surface wind stress from NASA’s QuikScat mission; sea surface temperature from the NASA/Japan Aerospace Exploration Agency Advanced Microwave Scanning Radiometer-EOS; sea ice concentration and velocity data from passive microwave radiometers; and temperature and salinity profiles from shipborne casts, moorings and the international Argo ocean observation system.
Story Source:
The above story is reprinted from materials provided byNASA’s Goddard Space Flight Center.
http://www.sciencedaily.com/releases/2012/04/120409204414.htm
Note: If